New & Improved Performance Tracking
Contact center team leaders were flying blind. The redesign wasn't about adding more data. It was about surfacing the right data, in the right hierarchy, at the moment a decision is made.
- Project
- B2B CCaaS platform analytics
- Role
- Product Designer, full design ownership
- Team
- Developers, stakeholders, designers, writing team
- Platform
- Web, cloud contact center software
- Scope
- Discovery to a shipped analytics system
2
Independent research tracks
5
Participants per testing round
30s
The decision window we designed for
1
Analytics design system, adopted platform-wide
A decision-support problem, not a data problem.
Team leaders monitor agent performance and allocate resources to high-demand queues. They were working with a dashboard that was dense, poorly structured and not built around how they actually made decisions.
The question wasn't "how do we display these metrics better?" It was "what does a team leader need to see to make a good call in the next 30 seconds?"
Two product discovery workshops with developers, stakeholders and designers produced concrete deliverables upfront: personas, initial prototypes and a UX audit of the existing design.
Wrong metrics surfaced
The metrics that drove day-to-day decisions weren't prominent, and the prominent ones weren't actionable.
No way to act
Leaders could see a queue was overwhelmed but couldn't reassign agents from the same view.
Couldn't scan quickly
Getting a status read took too much cognitive work for a fast-moving environment.
Two tracks, deliberately.
Existing clients
Interviews and usability testing with current users. Deep domain knowledge, real operational context and grounded feedback on the old tool.
usertesting.com
Pre-screened for contact center size, metric familiarity and reporting practices. No prior platform exposure, so an honest signal on whether the design stood on its own.
Using only existing clients risked validating familiarity rather than usability. Every metric we surfaced was validated through both tracks, not assumed and not stakeholder-driven. If team leaders couldn't say why a metric mattered or what they'd do with it, it didn't make the cut.
Iterate until the bar is hit.
Discovery
Personas, UX audit, initial prototypes and agreement on what success looks like.
Wireframes
Structure before visuals. The writing team refined labels: in a dashboard, label language is a UX decision.
Moderated testing
Navigation, hierarchy clarity and metric comprehension, through realistic decision tasks. Five participants per round.
Iteration
Prototypes refined between rounds until task success and comprehension hit the bar we'd set.
Stakeholder alignment came from good working relationships and evidence-backed decisions. There was no significant conflict, because the direction was grounded in data stakeholders had helped gather.
Built around the decision, not the data.
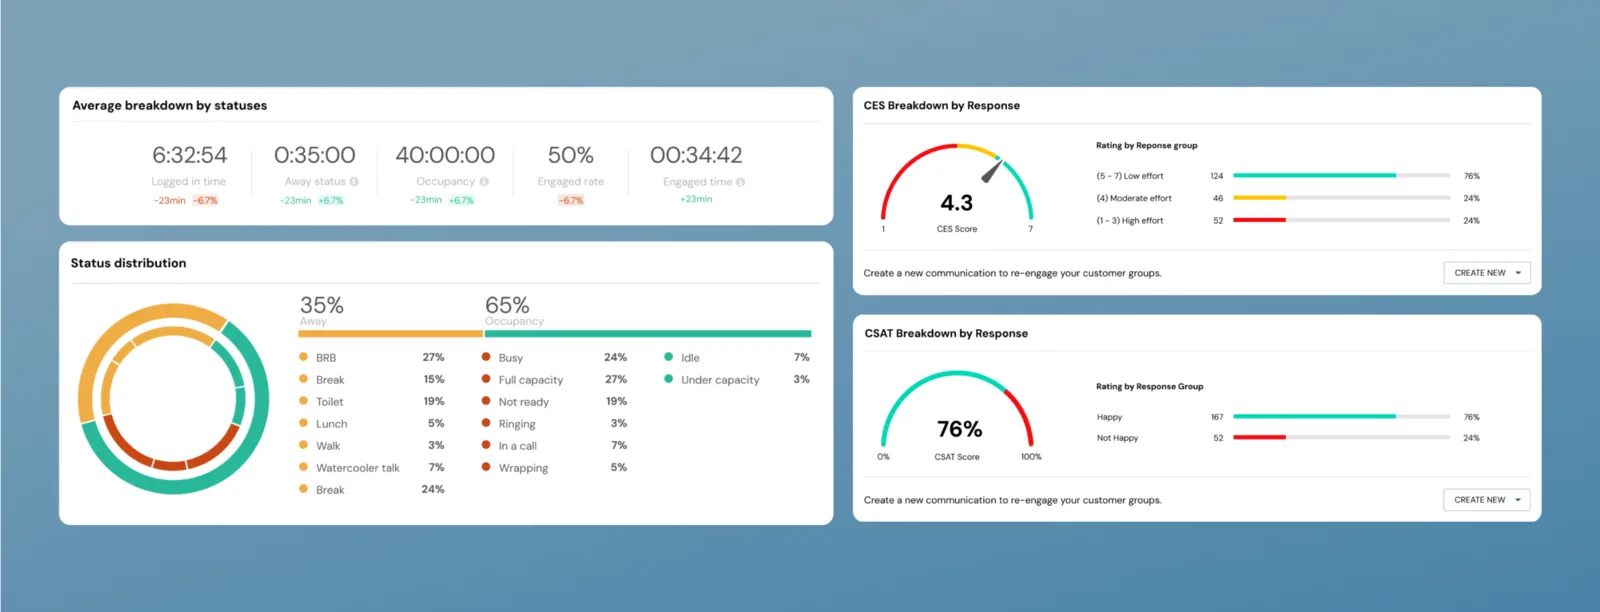
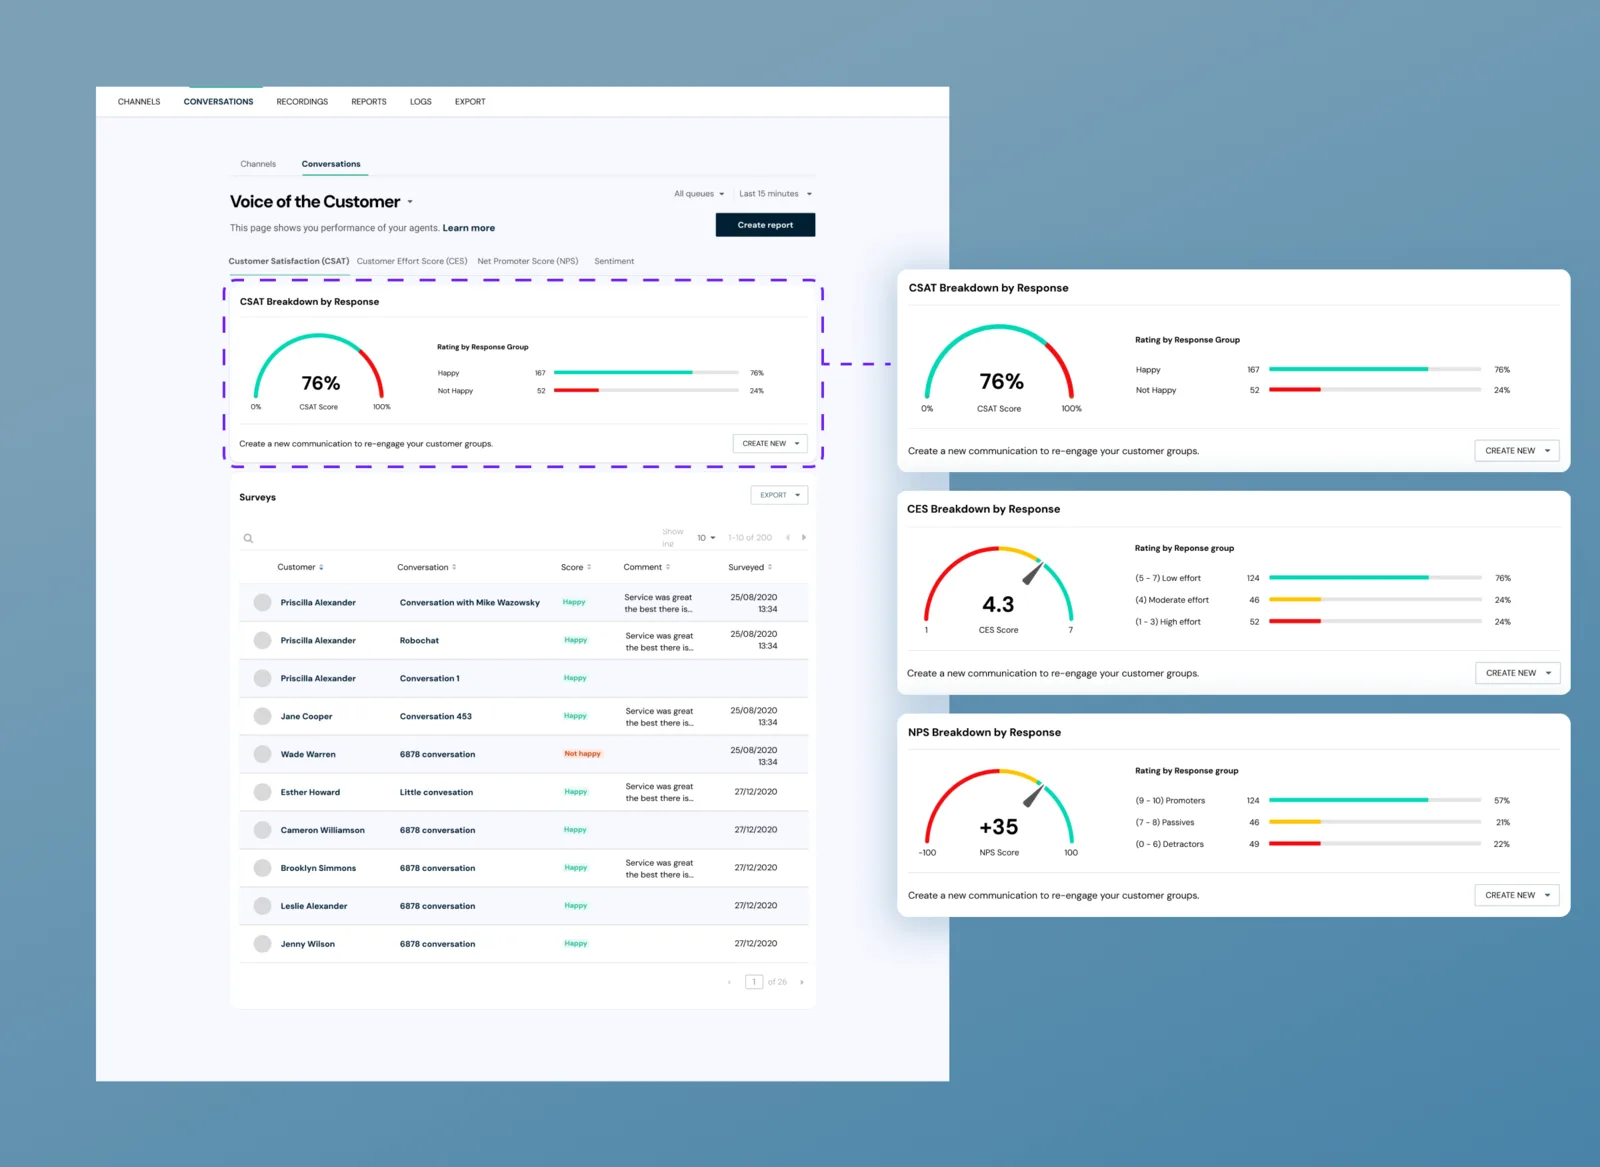
A scannable view of team performance with the right metrics at the right level of hierarchy. Queue status at a glance, and agent assignment from the same view: no switching between insight and action.
An overview of their own performance, with the same data their team leader sees, supporting accountability and self-management.
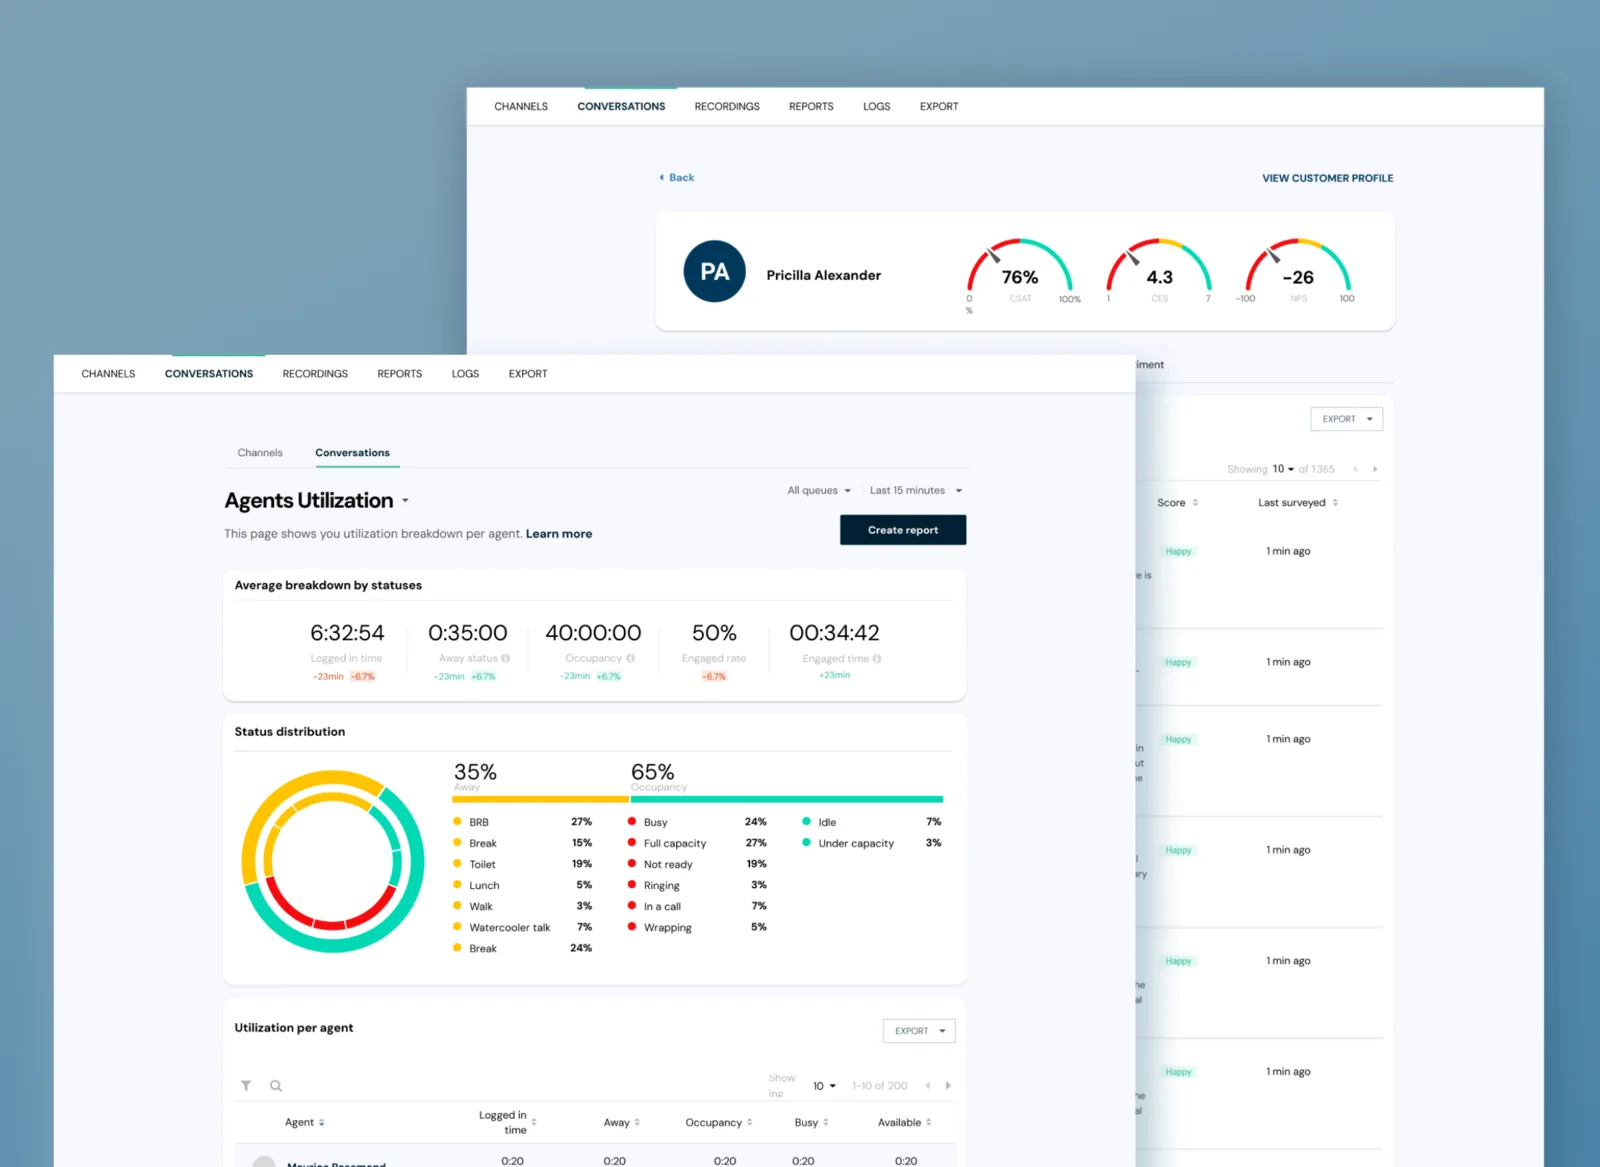
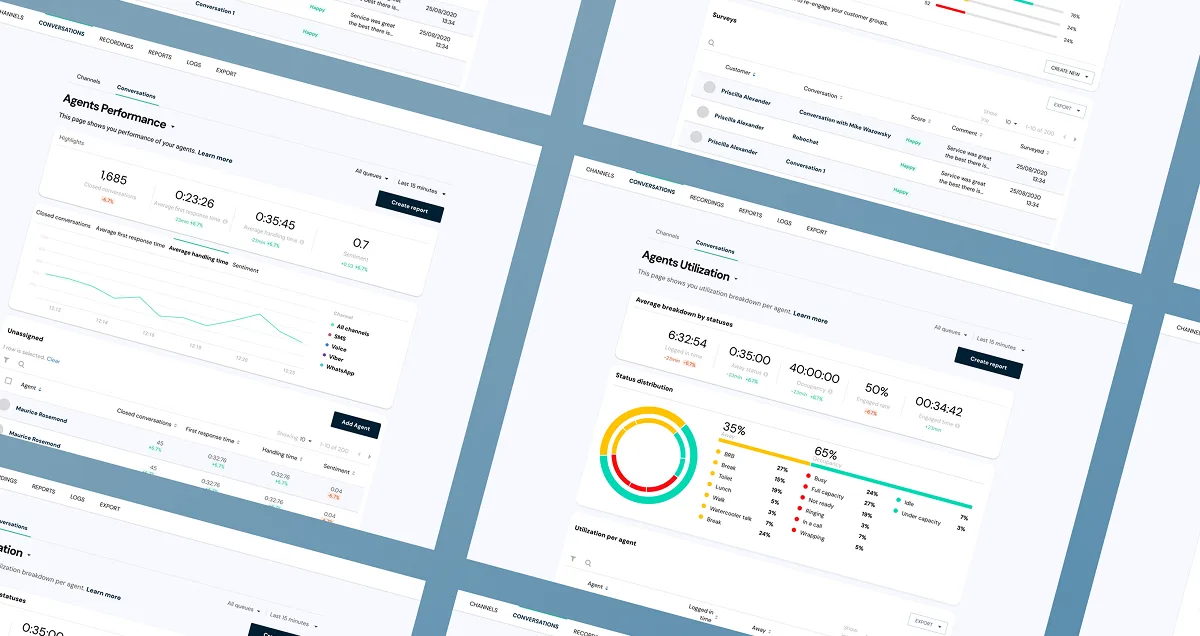
The analytics design system was built specifically for this product and later integrated into the global platform design system: data visualisation components, metric cards, status indicators and hierarchy patterns, all defined, documented and reusable across the platform.
Qualitative wins, honestly presented.
Quantitative usability metrics aren't available to share. What testing validated: team leaders could read queue status and agent utilisation at a glance, so the scan-speed problem from the audit was resolved. Participants understood what each metric meant and, critically, what action it implied. Agent assignment from within the dashboard worked as intended.
Rigour as a leadership act.
Full ownership on an enterprise analytics product meant structuring two-track research and making the case for both when one would have been easier, validating every metric through testing rather than stakeholder assumption, and building a design system that served the whole platform, not just this product.
It would have been faster to trust the existing audit and ship. The extra rigour took more time and produced a significantly better outcome.
apphour →